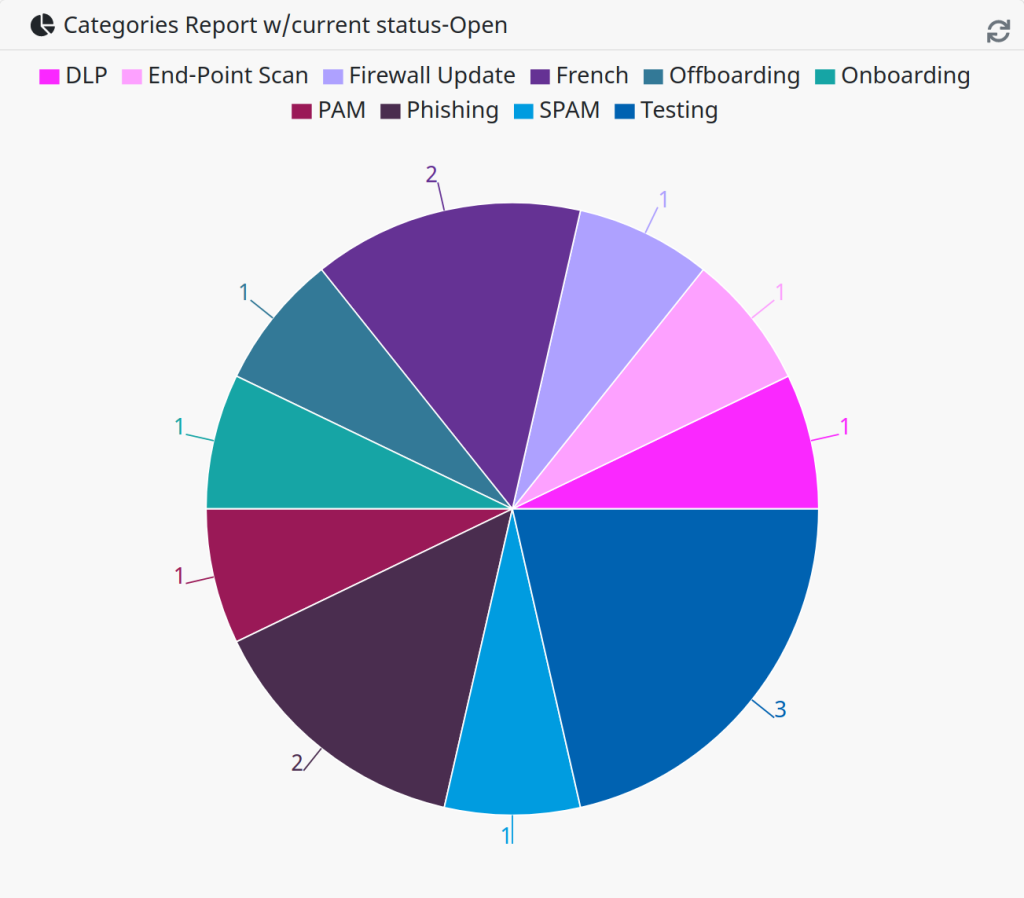
Categories Overview Report
This report generates category totals grouped by current status over a specified duration. The incidents included in the report are limited to those created within the specified duration.
Widget Type
| Widget Type | Description |
|---|---|
| Pie Graph | Creates a pie graph based on the selected report options. |
| Stacked Bar Graph | Creates a stacked bar graph based on the selected report options. |
| Bar Graph | Creates a bar graph based on the selected report options. |
| Table | Creates a table based on the selected report options. |
| Key/Value Pairs | Creates a key/value pairs table based on the selected report options. |
Report Options
| Option | Description |
|---|---|
| Statuses | Limits matching incidents to the set of selected statuses. |
| Duration | Defines the relative time span of the report. For example, some possible values are Last Week, Last Month, or Last X Hours. |
| Span: Value of X | When required by the chosen Duration, the number represents the X value for the selected Last X * duration. |
| Assignee | Restricts the report to the assignee. |
| Incident Categories | Limits matching incidents to the set of selected categories.
This is a required field.
|
| Reference | The end date/time of the report. |
Nevelex Labs, Main Office
Metro Office Park
2950 Metro Drive, Suite 104
Bloomington, MN 55425
Phone: +1 952-500-8921
©Nevelex Labs, LLC. 2018-2026, All Rights Reserved.
EULA