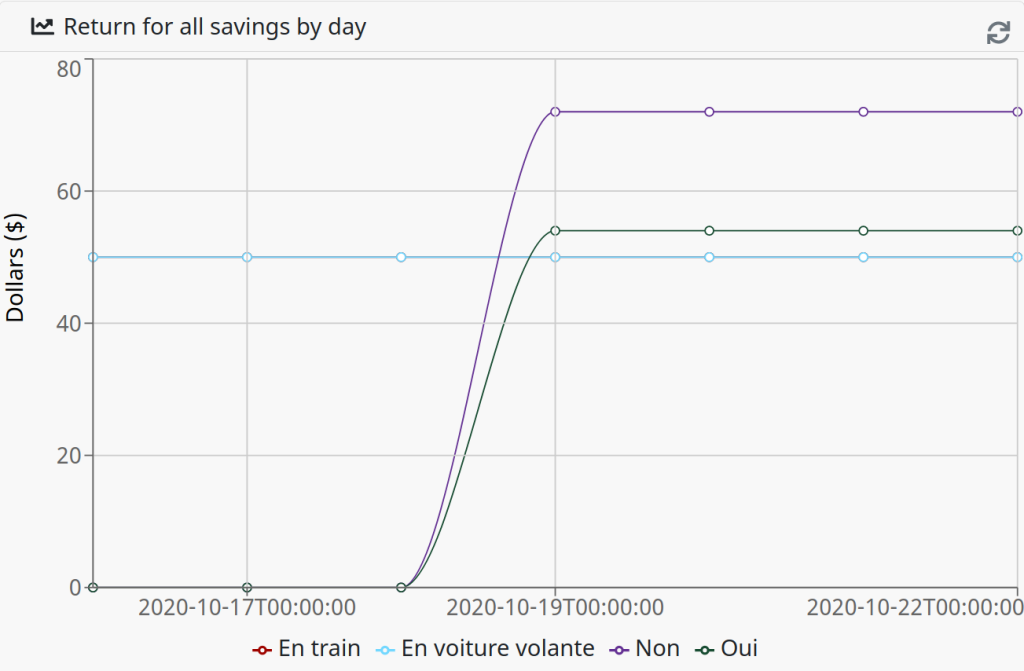
Return Cumulative Overview Report-Time Grouped
Report generates cumulative cost savings totals grouped by time intervals over a specified duration. The report's starting totals include all cost savings meta data matching the search criteria, regardless of when the actions were taken.

| Widget Type | Description |
|---|---|
| Stacked Bar Graph | Creates a stacked bar graph based on the selected report options. |
| Line Graph | Creates a line graph based on the selected report options. |
| Area Graph | Creates an area graph based on the selected report options. |
| Bar Graph | Creates a bar graph based on the selected report options. |
Report Options
| Option | Description |
|---|---|
| Statuses | Limits matching incidents to the set of selected statuses. |
| Interval | Defines the date-time grouping interval, which is the unit of time for grouping results.
This is a required field.
|
| Time/Cost Savings / Nodes | Limits time savings information to the selected flow nodes. Use the the Time Savings Information dialog to associate time savings and hourly rate information to a flow node.
This is a required field.
|
| Incident Categories | Limits matching incidents to the set of selected categories. |
| Duration | Defines the relative time span of the report. For example, some possible values are Last Week, Last Month, or Last X Hours. |
| Span: Value of X | When required by the chosen Duration, the number represents the X value for the selected Last X * duration. |
| Assignee | Restricts the report to the assignee. |
| Reference | The end date/time of the report. |
Nevelex Labs, Main Office
Metro Office Park
2950 Metro Drive, Suite 104
Bloomington, MN 55425
Phone: +1 952-500-8921
©Nevelex Labs, LLC. 2018-2024, All Rights Reserved.
EULA